
The results from a national survey “Experiences of NHS healthcare services in England: September 2025” seems to indicate that NHS online access is at a tipping point - online is becoming the main mode for accessing GP care. It appears that online (web, app and NHS App) has overtaken phone and in-person modes of contacting GP services. But digging into the data shows there’s more work to be done.
Firstly, it’s important to recognise that while the survey is reflective of the wider population in terms of demographics. It is an online survey which means it’s likely there’s a bias towards those who are more digitally active and confident. I’ll return to this at the end of this post.
Who’s Using Online Access
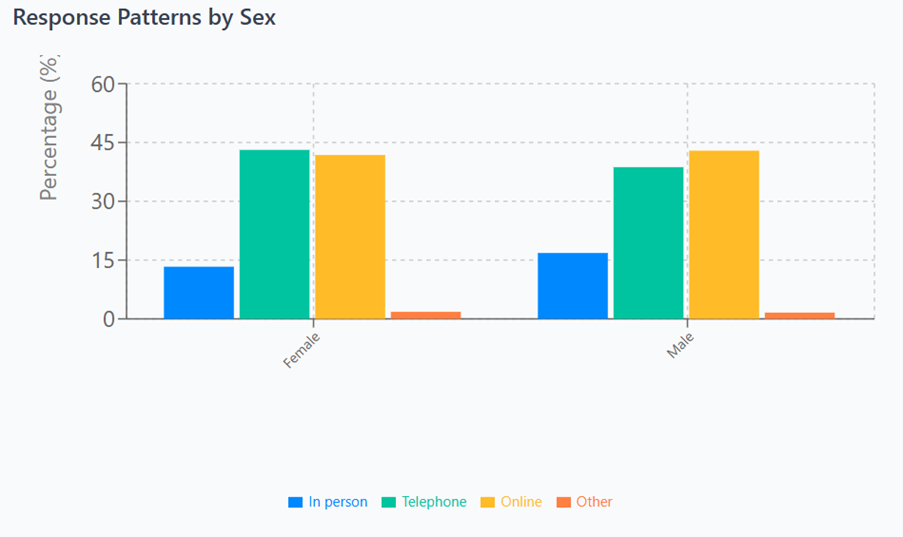
1) Sex: There’s a distinct male/female split, with online use tipping to the main mode of access in males while it's still the telephone for females.
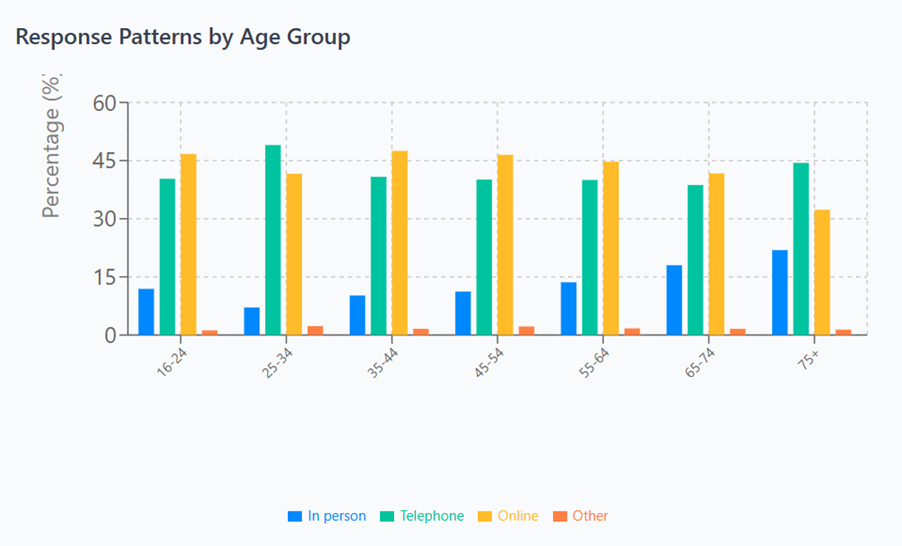
2) Age: Online access is becoming the main mode for GP access across most age groups with the exception of two age groups – 24-34 and 75+. It’s likely the 75+ group are less digitally confident or familiar. However, for the 24-34 categorisation it’s unclear what’s going on!
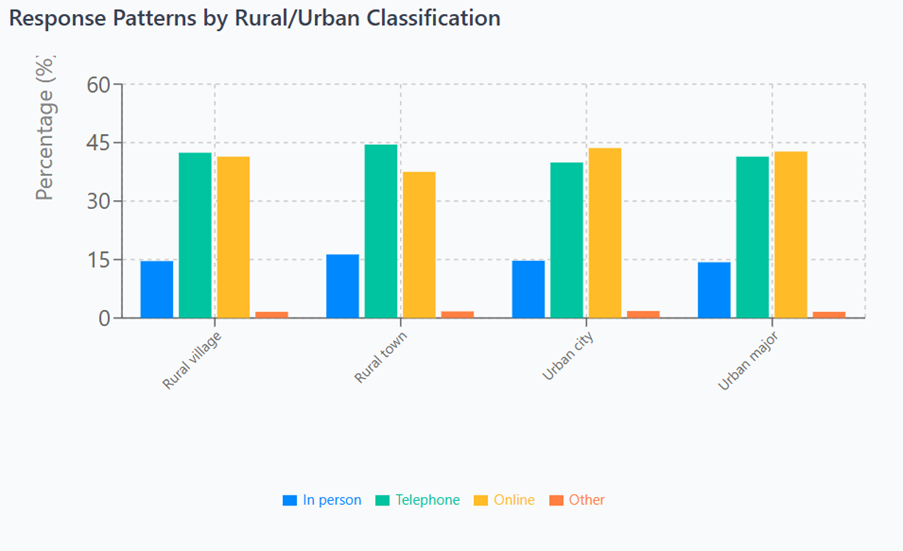
3) Rurality: Perhaps there's no surprises the more rural regions (Rural Towns) have more phone use than digital access compared to more urban regions. Rural regions stand to benefit the most from digital access but also more often have poorer digital infrastructure like broadband and 5G.
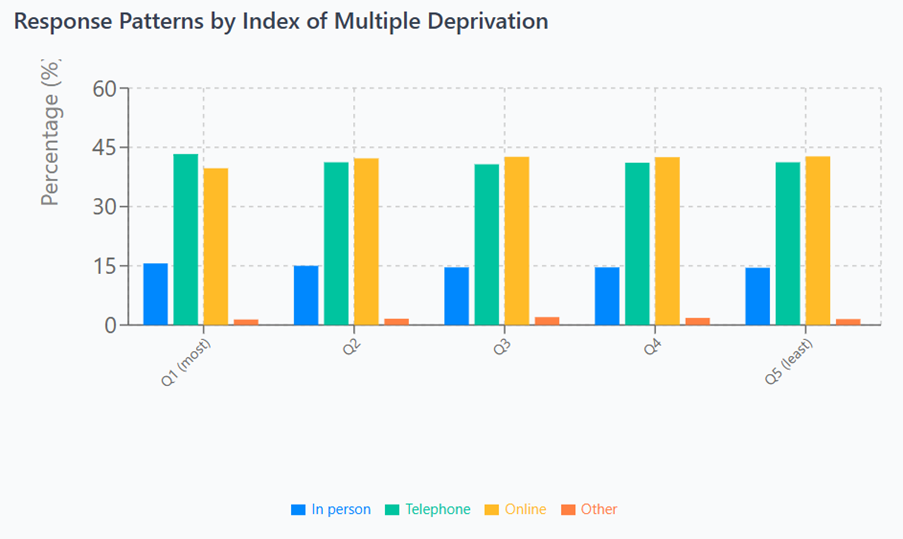
4) Deprivation: There’s noticeable difference in online use from the most to least deprived areas. The areas with high levels of deprivation have lower online access use. Most deprived areas have approximately 4% lower online use than the least areas of deprivation, so the most deprived areas have phone contact as the most common method of GP access.
The Digital Experience
Alongside who’s more likely to be using digital access there’s also the question of the digital experience. These are rated as how easy, neither easy or difficult or difficult are is online access.
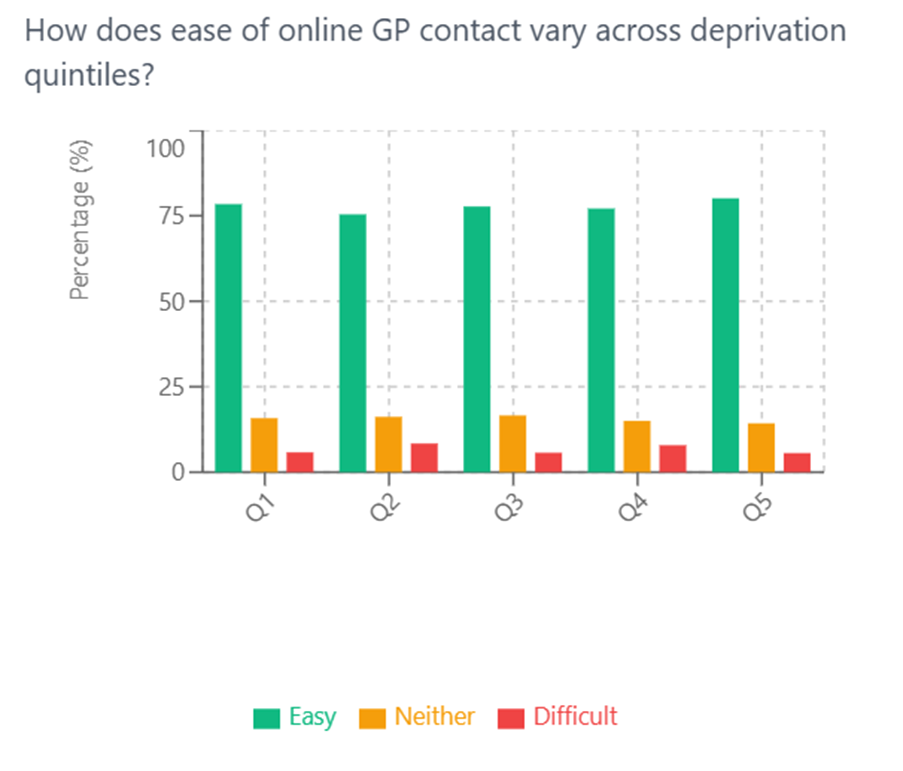
1) Deprivation: The ease of online access appears to be the same across different levels of deprivation. Deprivation can be an indicator of digital exclusion so this is surprising.
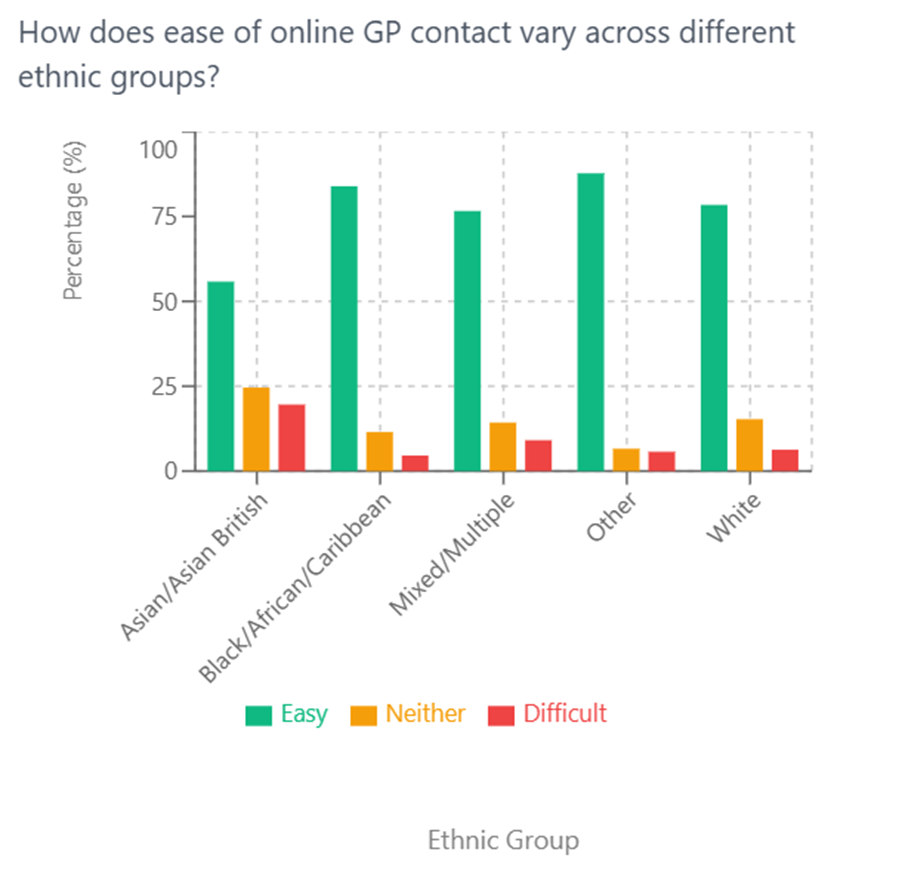
2) Ethnicity: However the ease of online access is highly variable with different ethnic groups. Much more needs to be done to improve language and cultural tailoring of online tools as well as work in communities.
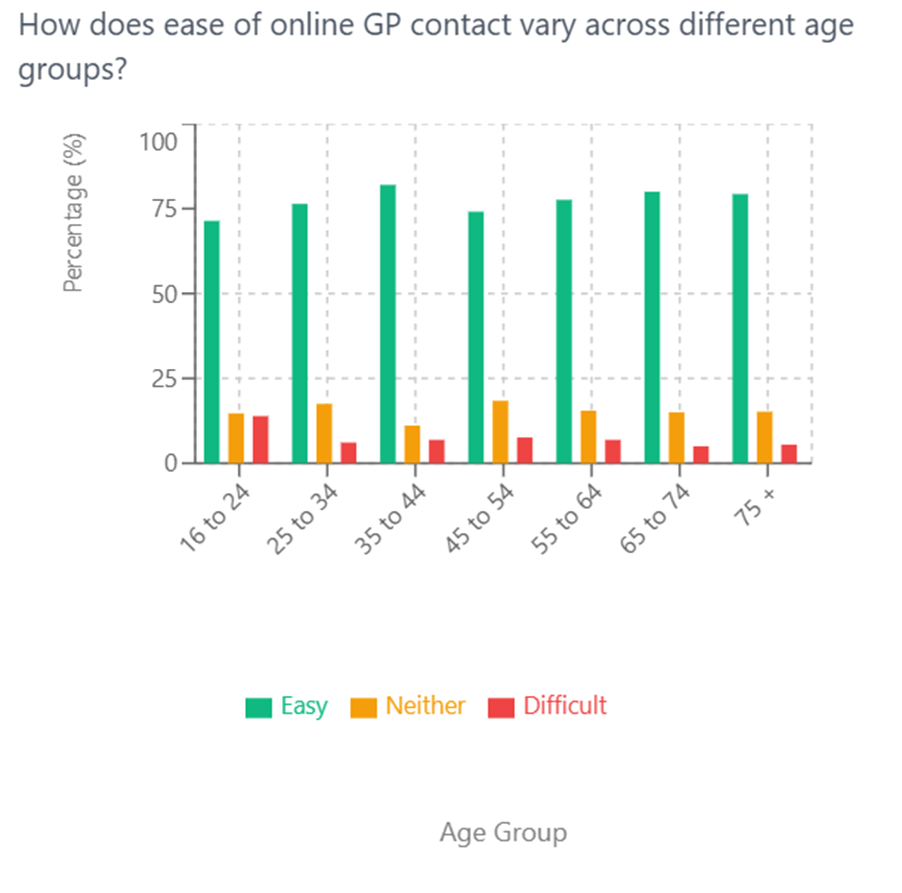
3) Age: Again surprising to see ease of online access is lowest for the 16-24 age group, counter intuitive to much of the assumptions surrounding digital natives. This could be due to familiarity with the tools or the design not meeting the expectations of that age group.
Summary
So online access is becoming the predominant way of accessing GP services for many but not all. There’s variation by sex, age, rurality and deprivation which shows there’s more that needs to be done to continue to support the public. The ease of use of online access is high across age groups with the exception of 16-24 age groups, indicating a need to better engage with this group to develop the digital tech. There’s concerning low ease of use amongst some ethnic groups which points to a need for greater focus to improve the tools and engage with these communities.
As mentioned in the introduction, there will be biases to this data. The online nature of the survey could mean we’re not seeing good representation of those who are digitally excluded. However, what is clear is that once people are digitally included they are more likely to use online access. The data also has insufficient information on the disabilities of people surveyed and how these impact online access and experience. It's important to not make assumptions regarding these groups and engage with people to validate and improve digitally enabled services.
It is good to see the hard work and investment showing a tipping point of online access becoming the norm. But there’s still more to do!
I hope you enjoyed this post, if so please share with others and subscribe to receive posts directly via email.
Get in touch via Bluesky or LinkedIn.
Transparency on AI use: GenAI tools have been used to help draft and edit this publication and create the images and analyse the data. But all content, including validation, has been by the author.